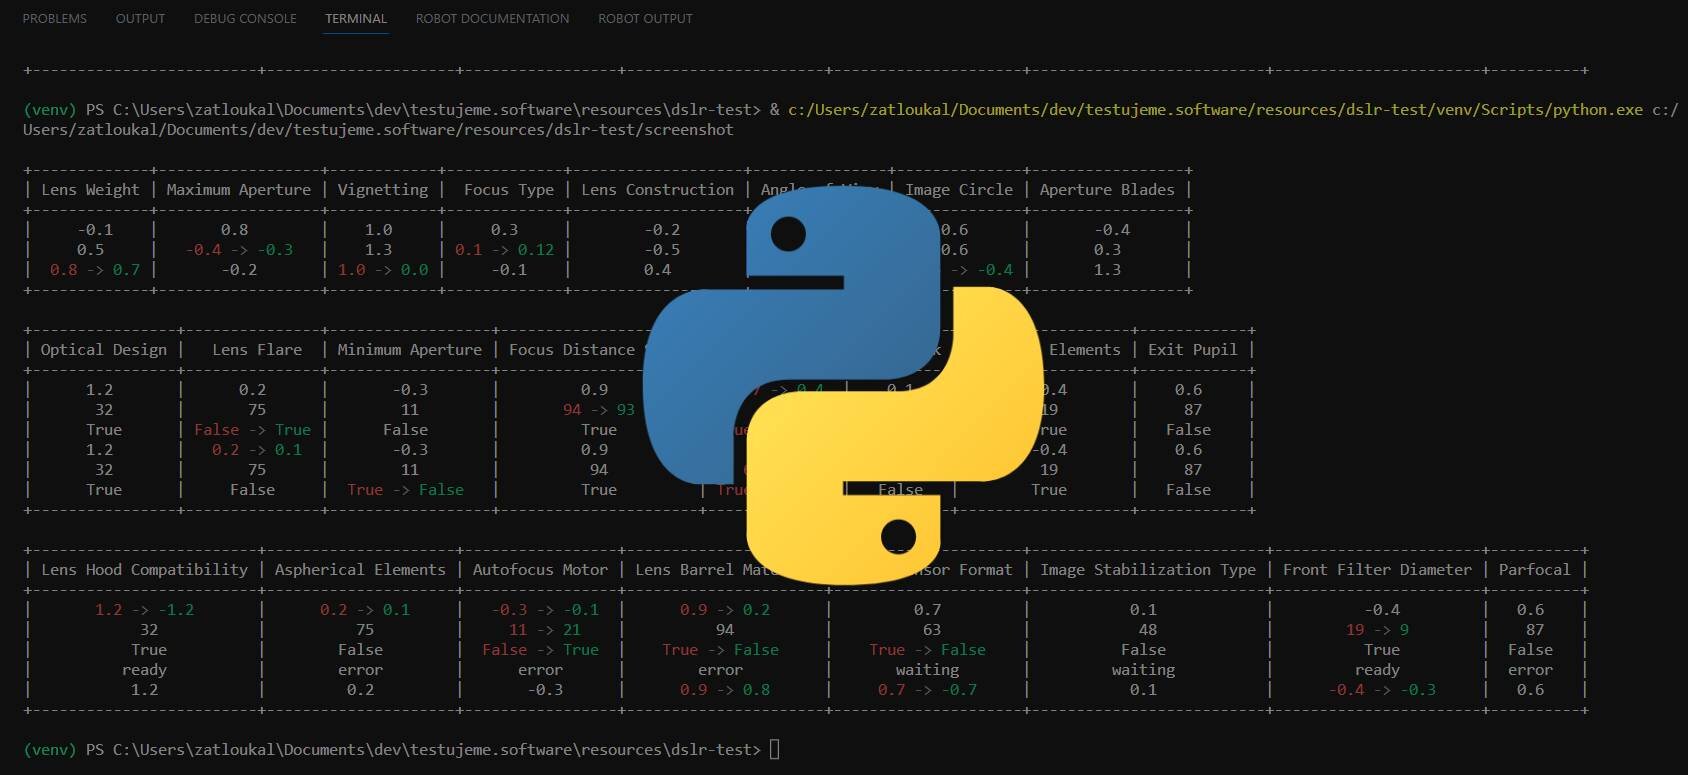
When testing complex systems, I often reach a state where I need to compare values before and after performing a certain operation. At the same time, I want to print out the complete state of the system and verify that the operation didn't affect anything else. My idea was to have all parameter values printed in a clear table and color-code those that have changed.
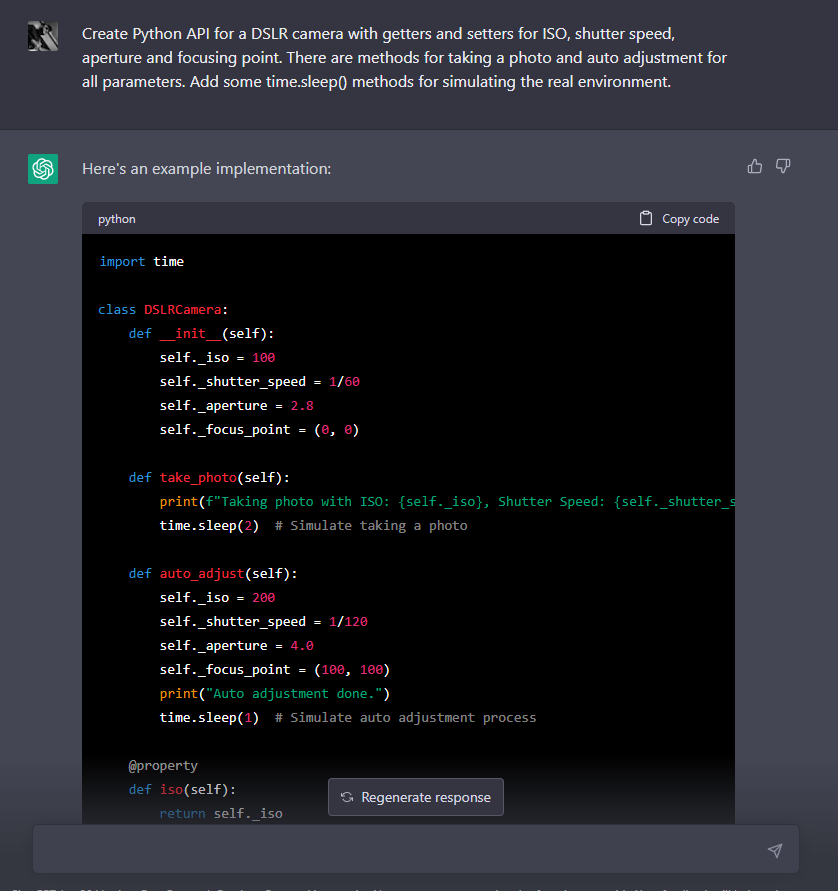
For the purposes of this article, I needed a sample application that would resemble my use when testing an electron microscope application. I thought of an API for controlling a digital camera - it's different from a microscope, but there are some lenses here too. And because I'm lazy, I let ChatGPT create such an API for me.
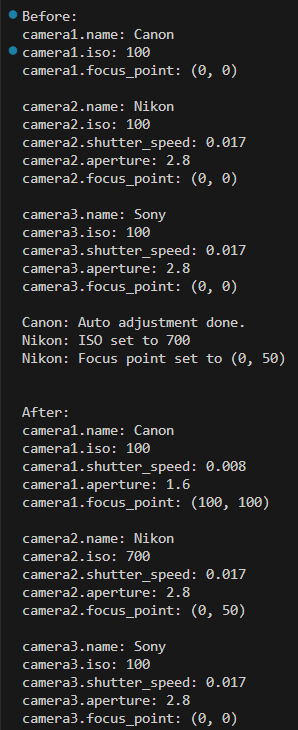
Classic Value Output
A simple printout of parameter values looks as follows. However, with a large number of parameters, such an output can be confusing. You can find the complete sample script here: test1.py
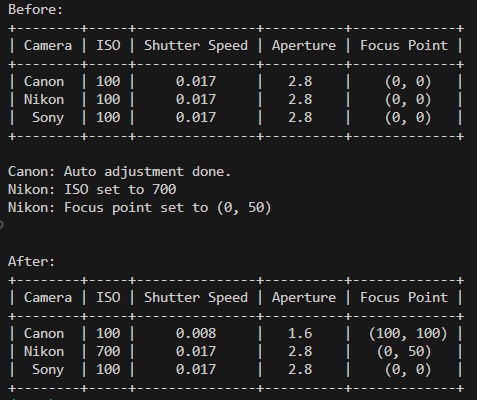
Now we can print a table, and the result is immediately more clear: test2.py
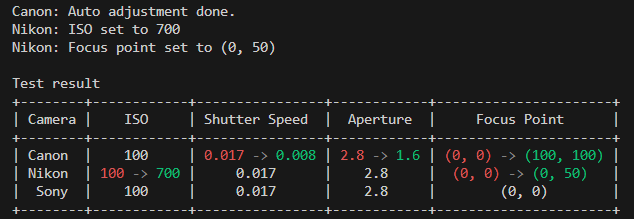
Comparing Values
Now all that's left is to compare both tables and highlight the values that have changed. Since the PrettyTable table is essentially a two-dimensional array, we just need to go through the individual cells of the first table and check if their value differs from the value at the corresponding position in the second table.
for x, row in enumerate(data_before): for y, cell in enumerate(row): if data_before[x][y] != data_after[x][y]: data_after[x][y] = ...
To highlight, we'll use the Colorama module, which will add colors to our output:
You can find all the scripts used and the tables_diff() function for comparing tables on our Github.
Share article
Author
Jan ZatloukalTester and developer with a passion for automation and improving the development process. I am currently working on an electron microscope automation project in Python.
Get the latest updates from the world of Edhouse – news, events, and current software and hardware trends.
Thank you for your interest in subscribing to our newsletter! To complete your registration you need to confirm your subscription. We have just sent you a confirmation link to the email address you provided. Please click on this link to complete your registration. If you do not find the email, please check your spam or "Promotions" folder.